
case studies

Systems I've built

Four systems. One of them is a live product you can open right now.

Flagship product · Live

BLKPVNTHR.OS

An AI-assisted wealth-building platform. It opens on a terminal; typing start loads the AI Brain, a knowledge graph where the graph is the application — every node is clickable and opens the Inspector. Behind the graph sit a quantitative research pipeline, a Personal Accounting Agent with bank integrations, a career goal tracker, an emailing assistant, and a day-to-day personal assistant.

Problem
Everyday people have no single place to learn how wealth gets built, see their finances honestly, and work a plan toward a goal. The tools that do exist are split across a dozen apps and assume you already speak finance.
Constraints
Financial data has to stay read-only and credentials must never touch the app. Nothing on the platform is investment advice, so every research and trading surface has to be honest about being paper-first, with live orders gated behind a paper-trading threshold. It also has to open for anyone, with no sign-up wall.
Solution
A React 19 single-page app built around a React Flow knowledge graph, with real modules behind each node: the AI Brain (/os), a finance engine, a trading engine, a research division, integrations, workflows, missions, Graphify, a vault, email, and memory. Banks connect through Plaid’s own secure widget — the app never sees bank credentials and the Plaid secret stays server-side. Balances only: no transfers, no trading. The Alpaca proxy targets the paper API, and live orders stay disabled until a strategy clears the paper-trading threshold.
Responsibilities
Sole engineer and designer. Product, information architecture, front end, Python research services, Supabase Edge Functions, and the nginx deployment on an Oracle Cloud VM.
Technology
React 19, TypeScript, Vite, Tailwind v4, React Flow (@xyflow/react), Zustand, React Router 7, Framer Motion, Recharts, Radix UI, react-plaid-link. Python (FastAPI) research services. Supabase auth plus six Edge Functions. Plaid and Alpaca. Vitest and oxlint. nginx on an Oracle Cloud VM.
Status
Live and public; opens in guest mode. Actively developed — some modules are production-oriented, others are experimental.
Science missions · Public-facing work

Space and mission software

Public-facing web and visualization work for heliophysics missions: mission portals, interactive explainers, and outreach and education visuals that help a general audience understand what a mission does and why it matters.

Problem
Space science is hard to communicate. Missions need public surfaces that are accurate, accessible, and usable by students, educators, and the press — not just by scientists.
Constraints
Detail here is limited to publicly released material. Internal systems, architecture, and restricted data are out of scope and are not described on this site.
Solution
Web front ends and interactive visualizations built for the public web: mission portal pages, explainers that walk a reader through the science step by step, and outreach and education graphics produced for release.
Responsibilities
Web development and visualization for public-facing mission material, working with the people responsible for the science and for communications.
Technology
HTML, CSS, and JavaScript for the web surfaces; Python for data handling and figure generation.
Status
Completed. Described here only at the level of publicly released material.
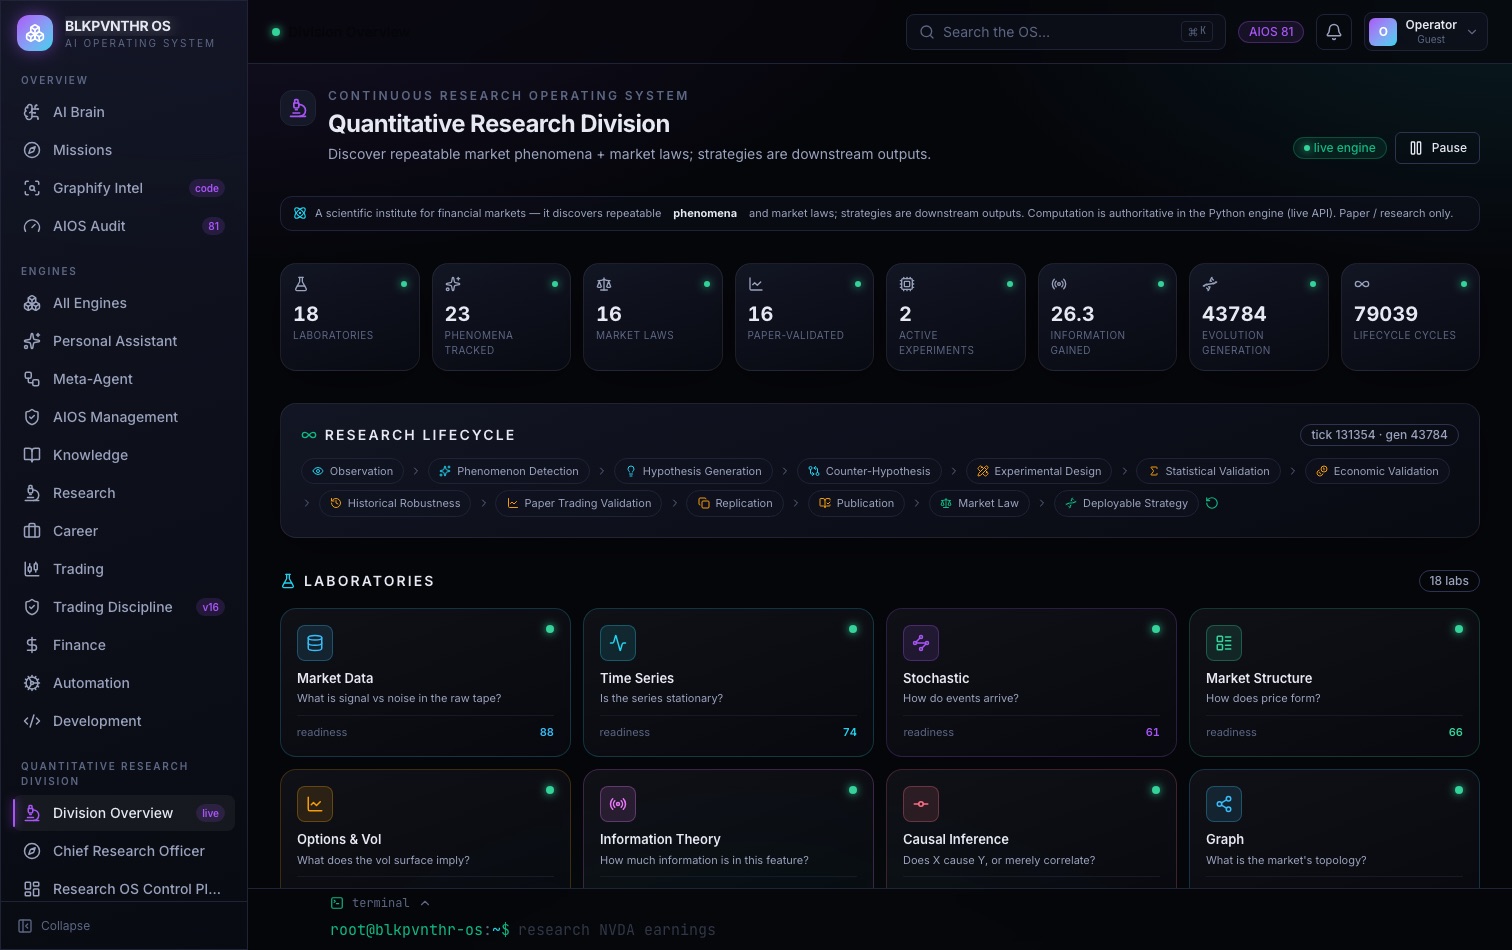
The BLKPVNTHR.OS Research Division: a board of 18 laboratories and a research lifecycle running from observation through validation to a deployable strategy. Figures shown are the product's own demo state, not a track record.

The product’s own demo/seed state. Any figures visible are illustrative — not real finances and not a track record. Paper and research only.

Research system · Paper and research only

Quantitative research platform

The research layer of BLKPVNTHR.OS, built as its own system: a stdlib-first FastAPI research engine with a pattern engine, alpha discovery, evidence fusion, and a strategy lab, organized into 18 laboratories.

Problem
Most trading research is a backtest and a good feeling. A finding that looks strong in-sample usually does not survive costs, a different period, or a different universe — and nothing in the workflow forces you to notice.
Constraints
Findings must be falsifiable, not flattering: every candidate has to pass through the same gates. Nothing produced here is investment advice, and the platform is paper-trading research first — live orders stay disabled until a strategy clears the paper-trading threshold.
Solution
A research lifecycle enforced end to end: observation, phenomenon detection, hypothesis generation, counter-hypothesis, experimental design, statistical validation, economic validation, historical robustness, paper trading validation, replication, publication, market law, and only then a deployable strategy. Walk-forward analysis, evidence and provenance tracking, risk gates, and paper trading are part of the pipeline rather than an afterthought.
Responsibilities
Design and implementation of the research engine and its services, the lifecycle itself, and the Research Division interface that exposes it.
Technology
Python and FastAPI, stdlib-first, across research_engine, pattern_engine, alpha_discovery, evidence_fusion, and strategy_lab. Served on 127.0.0.1:8010 and reverse-proxied by nginx at /research-api. React and TypeScript front end.
Status
Live inside BLKPVNTHR.OS and actively developed. Paper and research only.

Data and AI

Data and AI systems

The Cost of Democracy — a data-analysis project that asks how the last election cycle moved the price of everyday goods, and answers it with a reproducible pipeline rather than a headline.

Problem
Prices shift after big events, but the shift is hard to see honestly. The data is scattered across retailers and search results, in inconsistent formats, and no single source tracks year-over-year change on a basket of common goods.
Constraints
Public data only, through one search API with rate limits — so the pipeline needs a fallback for when the API comes up short, and the results have to be saved and reproducible, not just printed once in a notebook cell.
Solution
A Python and Jupyter pipeline that pulls historical prices for a basket of goods (ground beef, sugar, eye drops) through the SerpAPI search API, falls back to direct web scraping when the API returns too little, normalizes the results with pandas, computes change from 2024 to the current year, and writes the output to CSV alongside plots for visualization.
Responsibilities
Sole author — data sourcing, the scraping and fallback logic, the pandas analysis, and the notebook itself.
Technology
Python, Jupyter, pandas, requests, SerpAPI (google-search-results), python-dotenv.
Status
A working research notebook, public on GitHub. The same pattern — pull messy third-party data, normalize it, make it legible — recurs throughout my work.

More code on GitHub →

Visual and mission imagery lives in the gallery.